Evaluation
Index
This chapter evaluates the proposed work by analysing the actual implementation of several use cases for the prototyping architecture. For each case we do a short description of the problem, a memory of the development process, a summary of the developed processing and graphical components and a discussion on how the architecture performed. Use cases were approached in parallel to the architecture definition, development and refining so, some flaws detected in early use cases get fixed in later use cases.
At the end of the chapter we apply a set of systematic criteria to qualitatively evaluate the architecture and analyse the current limitations.
Use case: SMS processing
We used this first use case to implement the basics of the prototyping architecture elements. As both developments were very interleaved it can not be used to evaluate the efficiency of the process, just to explore its capabilities and evaluate the quality of the final product.
Spectral modeling, often referred as Spectral Modeling Synthesis or SMS[SerraPhd], is a technique that gets an alternative representation of the sound which splits the signals into a set of sinusoids and an stochastic residual. SMS representations enables high level manipulations of the sound by manipulating both components independently[SerraHighLevelTransDAFX] [SerraMorphICMC].
The key elements of the spectral modeling are the analysis and the synthesis. The analysis (figure fig:SMSAnalysisBlocs) is the process of obtaining the sinusoidal and the spectral components given an audio stream. The synthesis (figure fig:SMSSynthesisBlocs) is the inverse process, reconstructing the original signal given the spectral components. Analysis and synthesis are streaming processes; each audio frame corresponds to a pair of spectral peaks and a residual spectrum.
Transformation processes can be performed in the middle. Most of the transformations are also streaming processes. But, for instance, SMS time stretch effect is a example of transformation that can not be executed in real-time conditions, because input and output streams are not synchronous in time. Anyway, the architecture could enable its implementation if the source of the target stream does not impose real-time constraints, such an audio file or a in-memory representation.
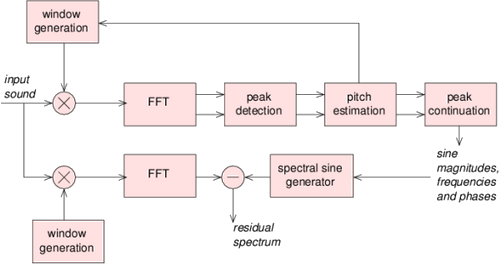
SMS Analysis block diagram.
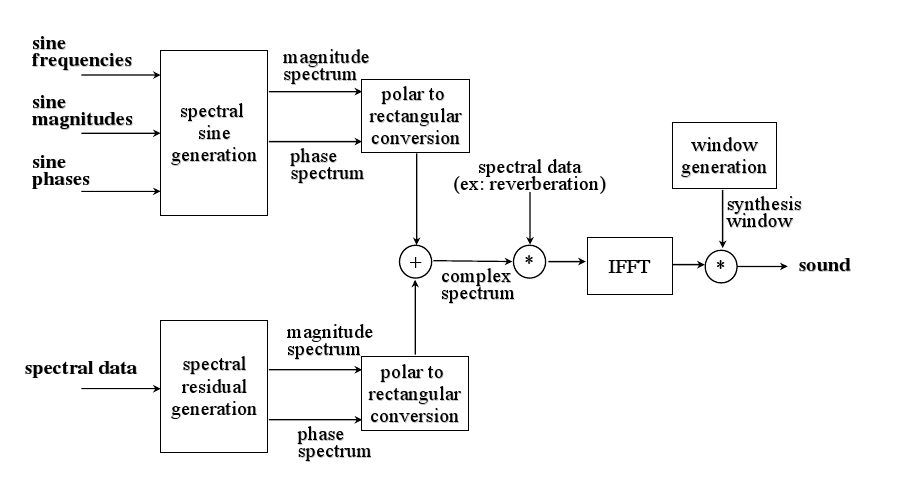
SMS Synthesis block diagram.
Development memory
At the time this experiment started, the CLAM framework already contained code for SMS technology. Indeed most of the processing modules in the CLAM were related to spectral modeling. But they were implemented in the context of an authoring tool, CLAM SMSTools, which did all the processing in off-line, and the implementation was not ready for stream processing. Existing modules at the time were tightly coupled to an in-memory representation of the full audio item, where the results of the analysis and successive transformations were dropped. So in order to move them to the prototyping platform we had to redesign them as streaming processes.
Removing references to the in-memory representation was a very hard process because hidden dependencies on the code existed and we often broke the code. We finally decided to revert all the changes and repeat the port with exhaustive back to back tests.
Communicated data object were audio buffers, spectra, spectral peaks and fundamental frequency candidates. In order to visualize them we developed a first version of the Port Monitor solution. After most of the basic elements were set up (analysis, synthesis and views) we started to build up applications. Mostly effects for instance:
- SMS Pitch Shift effect, already shown at figure fig:SMSTransposition, which changes the frequency of the sinusoids.
- Gender Change effect, figure fig:GenderChangeApplication, which turns male voices into female voices and female voices to male voices.
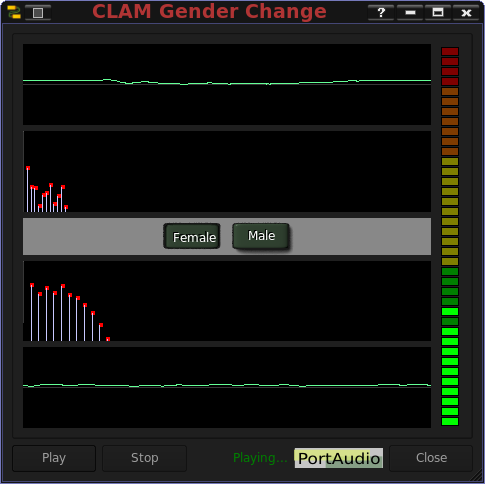
The GenderChange application based on SMS technology working on real-time.
Interface components
As explained above, three new views based on port monitors had to be developed: The Oscilloscope, to view audio streams, the Spectrum View to see the residual component and other spectra, and the Spectral Peaks View to see the sinusoidal component.
Applications also required widgets to send control events of different kinds: Bounded floating point, boolean and enumerations. We reused the widgets provided by the Qt toolkit and implemented control sender processing modules to bridge the threading gap.
Discussion
By forcing modules to work with ports in streaming, we decoupled the transformation modules from the handling of the in-memory structure. All the code to access on the structure a given data on a given instant of time was thrown away. By hiding the time handling details, the code of the transformation modules became more compact and understandable (a mean of 40 percent decrease in SLOC).
All the hidden dependencies were turned into module ports and control which made dependencies explicit both for the user at the network level while visually prototyping, and for the module maintainer on the C++ code.
So, migrating to the new architecture forced to refactor the code toward a good design: separation of concerns, definition of well defined interfaces... And we consider this a sign of having a good Path of Lowest Resistance.
Use case: Multi-faceted real-time Analysis
This small project started as some CLAM user asked on the mailing list for supporting MFCC [DonaldCepstrum] and LPC analysis on the CLAM Music Annotator. The CLAM Music Annotator is an authoring tool for doing off-line analysis and visualizing and editing the results.
Although user requested them for the Annotator, such analysis are able to be implemented as streaming and testing and assembling could be more easy visually so we first implemented them as a real-time analysis and then reused the components on the Annotator.
This use case is simple but interesting because introduced the need of reusing view components for different port data types.
Development memory
Again the components were already in CLAM but not ported to be usable from the Network Editor yet. Also there was a pair of programs that did the assembly of objects and the extraction for each analysis. So we ported the modules and assembled them within the Network Editor.
Also the visualizations were missing. Most of the data to visualize were float arrays, to be visualized as line or bar graphs. But the actual data on the port was not float array but more abstract types such as LP Models which contains two arrays, the filter coefficients and the reflection coefficients. In this case for example, we had to create two different Port Monitors getting the same type of port but offering different data with the same interface.
Then the widget that displays the Graph Bar could just take the array wherever it comes from, by using this uniform interface which also provided meta-data such as the labels or the numeric intervals to compute them, the units, the bounds of the function...
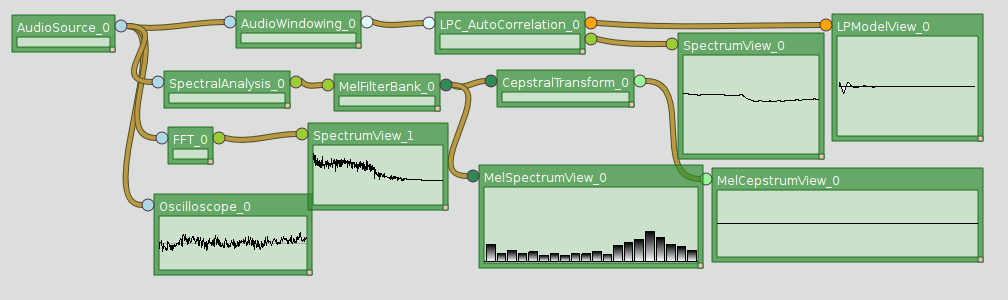
Processing components of the multifaceted real-time analysis.
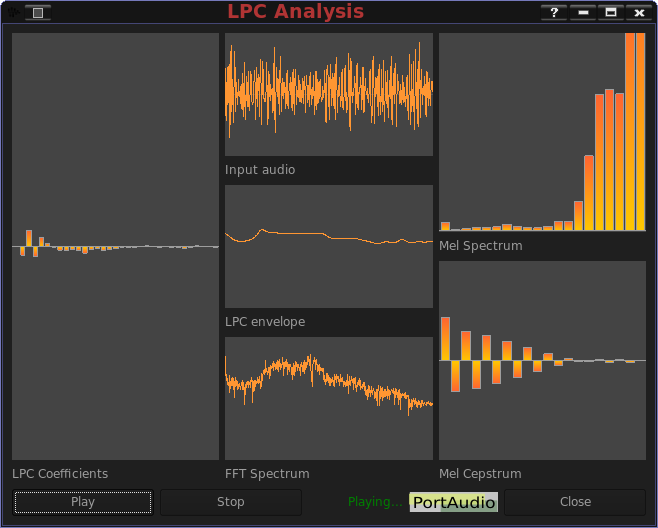
A multi faceted real-time analysis showing different views of the incoming sound: LPC coefficients, Oscilloscope, LPC envelope, FFT spectrum, Mel Spectrum and Mel Cepstrum.
In order to reuse the Bar Graph view on the Annotator we provided an implementation of the same interface but instead of taking the data from a port monitor, it retrieves the data from the in-memory representation of the off-line computed data.
Use case: Chord Extraction
This experience happened while the prototyping architecture implementation and concepts were usable but still incomplete and it provided useful insights of the requirements and the applicability. It is also useful to see the process, costs and benefits of porting a research Matlab code to the prototyping architecture. The developer was myself, so the results are not valid to analyze other factors such as framework usability.
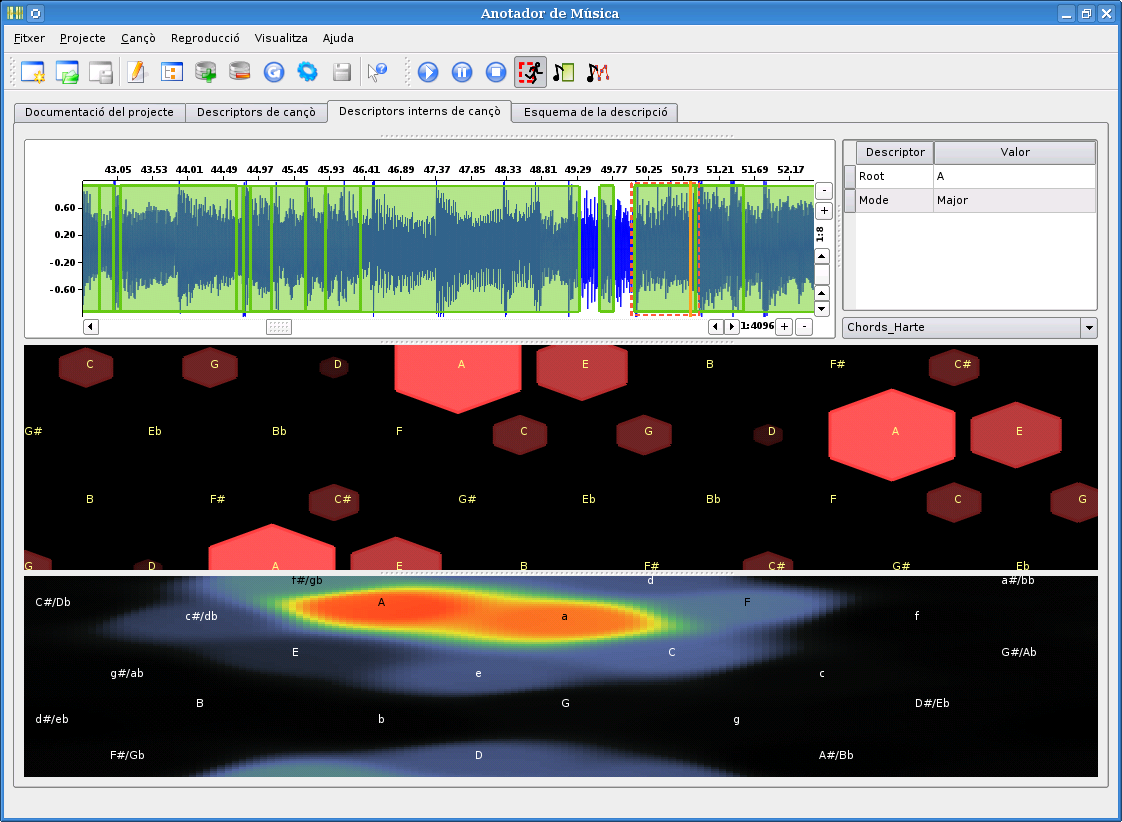
The chord extraction in CLAM is an implementation of the algorithm described by Harte in [HarteConstantQChords] and it is based on Harte's existing Matlab implementation. We modularized and ported the original Matlab implementation with a very close support of Harte and other colleges from his lab, we did some drastic optimizations and real-time adaptations, we created some instant-views for chord analysis, and adapted all to the prototyping architecture. An screen shot of the final application is shown at figure fig:TonalAnalysisWithPCPgram.
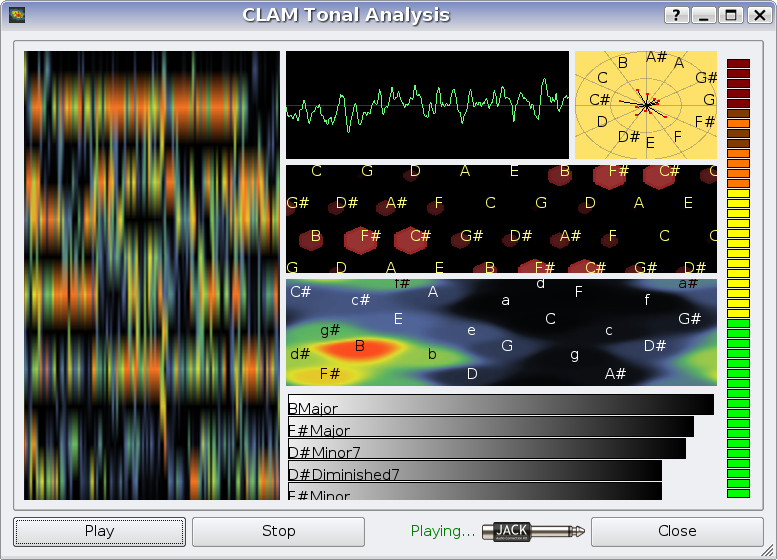
The 'Tonal Analysis' prototyped application.
Development memory
The code port followed a tight methodical process this time. Firstly I set up a battery of back to back tests to the full algorithm. Such back to back tests were useful to do refactoring on the original Matlab code. I also placed some back to back test on intermediate points of the algorithm. Once the original code was propped up, I started to refactor the Matlab code to extract little modules with strong cohesion. Every time a new module was identified, white box unit tests were created. Such unit test were used as a guide for test driven developing the module in C++. As more C++ modules were available, intermediate back to back references were used as input or output to back to back testing the aggregation of C++ modules.
Modularity made it also easier to profile the full algorithm to detect modules which were critical in performance. After doing some enhancements the code was optimized from lasting 30 times of the excerpt duration to last a third of the excerpt duration. That allowed us to increase the temporal resolution of the algorithm while still being real-time, and it also allowed us to be less conservative with the frequency of execution of the tests.
Although the algorithm was optimized enough to be executed on real-time, one of the components was non-streaming and the execution had to be off-line. So the first integrated version of the algorithm, instead of being integrated into the prototyping architecture was integrated on the CLAM Annotator which allowed off-line execution.
Two instant views were added to the Annotator to visualize some of the algorithm outputs: the Key Space and the Tonnetz which I explain below. Having some views that had to be port monitors on the future spotted the need of setting an abstract interface so that the view could access transparently real-time computed data through a port monitor, or an in-memory non volatile representation such the one that used the Annotator.
Later on, I substituted the module that forced off-line execution, which was related to the tuning detection, and all the modules could be managed by the Network Editor. Back to back tests are no more useful when you are trying to enhance the algorithm. So, in order to check future improvements, a precision/recall test was set on the Beatles hand annotated collection.
With the new real-time incarnation of the algorithm, further improvements were tried. For example, considering the none chord with the same weight for all the pitches, helped to discard tagging as chord segments of the song were there was no real tonal. The network editor made easier to create and use alternative components to the existing ones. Also to fine tune parameters as they are part of the configuration. Moreover, new views of the intermediate data, such as the Polar Chroma Peaks and the Chord Ranking views, gave more insight about what was happening on the algorithm.
Processing components
Most of the components for the Tonal Analysis prototype had to be reimplemented from scratch taking the Matlab implementation as reference. The criteria to define the modules boundaries has been finding proper algorithm points where a representation change was produced or where a given representation suffered some clear operation. The modules we defined are the following ones:
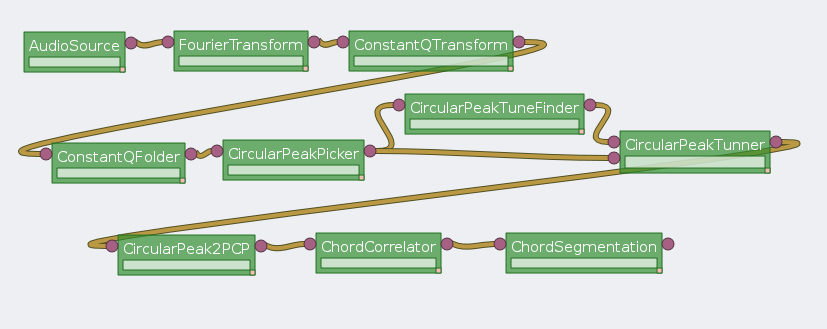
Processing modules of the tonal analysis
Fourier Transform: Original code used the intrinsic FFT operation in Matlab. For the C++ version, we used the 'Fastest Fourier of the West' [FFTW98] implementation which offers a great speed up.
Constant Q Transform: Takes a spectrum and multiplies it by a matrix to get a spectral representation where the distance among bins is proportional to the bin frequency. The output has the same number of bins to represent each semitone.
Constant Q Folder: Takes a constant Q transform and folds it into an octave so that the bins for the same pitch note on different octaves get added. That representation is called the chromagram.
Circular peaks finder: Takes the chromagram and finds the quadratic interpolated peaks. It is circular because it considers the first and last bins as adjacent bins.
Circular peaks tune finder: Folds the peaks into a semitone and add them considering them as phasors where the cents within the semitone sets the angle and the peak magnitude sets the module. The vector sum gives the instant tunning and the tonal level of the frame. A parameter controls the inertia, that is how much of the past tunning results affects the current tuning to be used.
Circular peaks tuner: Takes the circular peaks and the detuning and corrects them to be centered on the standard center.
Circular peaks to pitch profile: Adds all the peak magnitudes within a pitch into a pitch profile. A parameter let's choose whether the peaks are weighted the same or they are weighted depending on their distance to the pitch center.
Chord correlation: Correlates the pitch profile with a database of chord models and outputs the correlation for each chord model.
Chord segmentation: Takes the chord correlation and decides which is the current chord. Several parameters play there such as the minimum chord length, the minimum factor between the None chord and the first chord correlation in order the first chord to be considered...
Interface components
In this experiment we explored the addition of views that could be useful either to the development of the algorithm or to a final user. Often the results of the algorithm are not resolutive. In such cases we discovered that a proper visualization was more informative than the output of the segmentation algorithm.
Most of those views were also reused on the Annotator, by providing front-end to the in-memory representation that implemented the same data source interface than the Port Monitor, thus demonstrating that real-time user interface is also useful to authoring tools environments.
The Tonnetz view showing a C major chord.
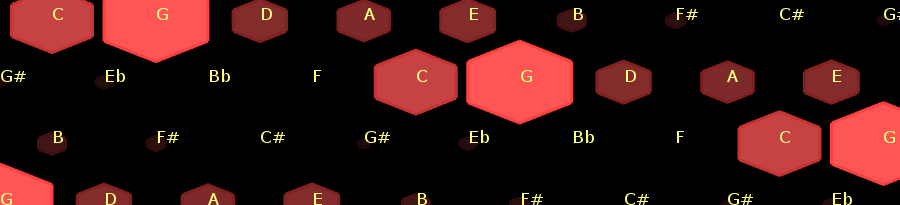
The Tonnetz view (figure fig:TonnetzView) displays the intensity of each pitch note in musical meaningful arrangement inspired in Riemann\footnote{A 19th century music theorist} network representation of harmonic relations [Tonnetz]. Notes are displayed as hexagonal tiles so that notes with harmonic relations are side by side. For instance, horizontal adjacent tiles form a series of fifth intervals, top-right adjacency means a major third interval while bottom-right adjacency means a minor third interval. Such distribution is interesting because common chord modes have a distinguishable shape (figure fig:TonnetzChordShapes).
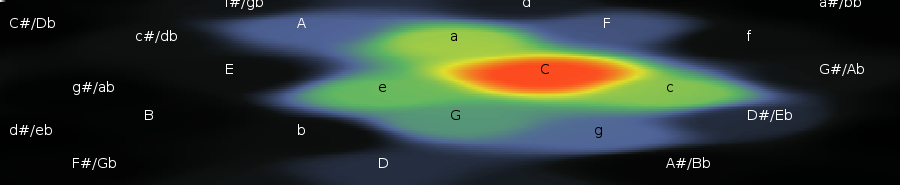
The Key Space view showing a C major chord. Minor chords labels are lower case.
The Key Space view [KeySpace] displays the probabilities of major and minor chords to be the sounding chord. It uses the chord correlation output. Chords are also placed so that chords with common pitches are placed together so that normally is seeing a colored stain on similar chords with a prominent color spot on the center highlighting the most probable cord. See the figure fig:KeySpaceView.
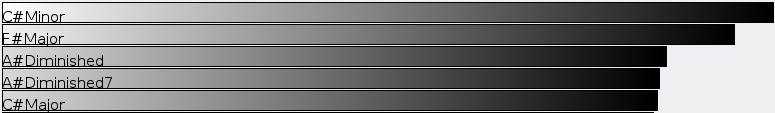
The Chord Ranking view.
The chord ranking view (figure fig:ChordRankingView) displays as horizontal bars the correlation of the top most probable chords in a frame. It allows see other chords than major and minor shown in the Key Space.
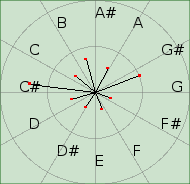
The Polar Chroma Peaks view.
The Polar Chroma Peaks view (figure fig:PolarChromaPeaksView) represents the peaks detected on the chromagram displayed as fasors in the octave circle.

Different chord modes are seen as different shapes in the Tonnetz view
Discussion
This first experience gave us some insight on the new development framework.
First, porting has asserted to be a source of a lot of translation bugs. The testing propping up we set up detected and located a lot of them that otherwise could not be detected until the final system was build, and at that moment, location would be very hard, and even more with the cross effect of different bugs acting at the same time. So, the porting method we used also proved to be useful.
Next, modularization helped in several aspects besides the testing. It helped to locate the performance edges by using profiling. It also helped to experiment with new alternative modules without throwing away the old implementation just by plug-in one or other module. Configuration
It was also proven that a network could be executed both in off-line and real-time modes. Also that instant views could be reused with minor effort in an authoring tool such the CLAM Music Annotator.
On the other hand the final application, although it was innovative and it impressed a lot of potential users, it had some usability concerns. We built a nice technology demonstrator but we failed to consider some aspects of its usage context. Such application was meant to be used for novice instrument players that wanted to know the chords of songs of their own personal collection. Instant views provide very volatile information so the user had to play back again the same excerpt once and again. The only way of controlling that was by accessing to the multimedia player that was piping audio to the analyzer. The application context switch was very inconvenient, as the user hands were often busy with the instrument.
That fact drove us to do a different version of the application that gets the audio from a file and controls the transport. This also solved another problem: the algorithm introduced very much latency into the output. By taking the input from a file, the analysis latency can be compensated by a delay.
Of course, because the components were shared, as the streaming version was still useful for other purposes, we still could keep both of them.
Integration of the chord extractor into the Music Annotator
Use case: 3D room acoustics simulator
This is one of the first projects built once the prototyping architecture was mostly stable.
Some months ago, two contributors to the CLAM project, Pau Arumí and myself, were hired to implement some existing acoustics technologies. A new system to simulate the acoustics of sound emitter and receptors moving within a virtual 3D scenario. After taking a look at the requirements we decided to implement most of the modules from scratch, and assemble them using the prototyping environment.
For this project we took two decisions:
- to reimplement basic spectral functionalities existing in CLAM to make them less complex, and
- to build up the components using the prototyping architecture.
Development memory
The system development was split in several phases:
- Solving the surround system (5.1 speaker components from pressure and velocity vector at the hot spot)
- Solving the real-time convolution
- Setting up a hyper-grid database of impulse response (an IR for each pair of 3D points; emitter and receiver)
- Solving the interpolation of the impulse response on the actual positions, taking the nearest points on the grid.
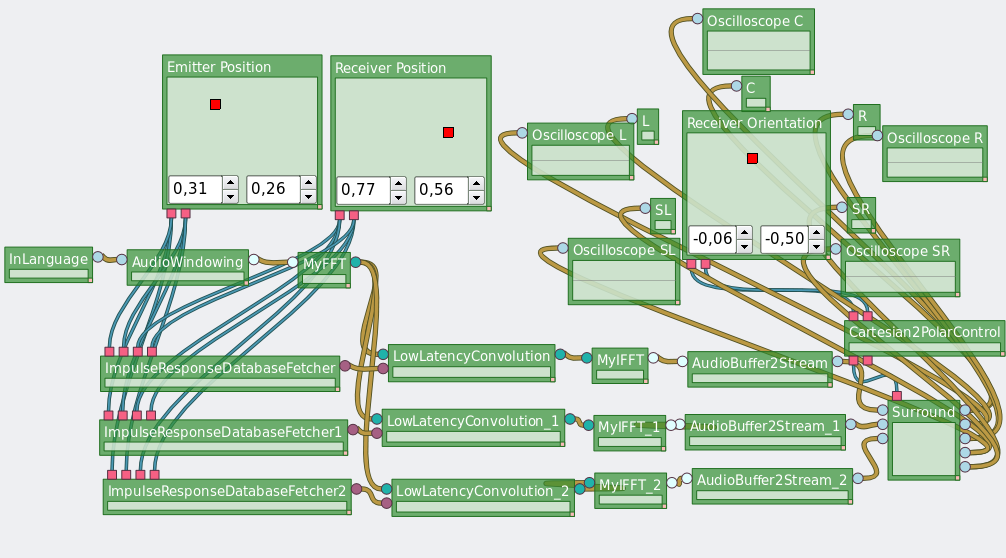
The virtual spacialization network.
Because each step is independent, each step could be addressed independently. This is a sign that the system eases progressive evolution.
Processing Components
Here we describe some of the components that composes the system:
Low Latency Convolution: This component does a convolution in an hybrid temporal-spectral domain. Hybrid temporal-spectral domain convolution means that it is a similar implementation than time domain convolution but multiplying and adding spectra from the discrete Fourier transforms (DFT) instead of multiplying samples. See figure fig:LowLatencyConvolution. By doing this, we get a compromise between the speed of spectral domain convolution and the low latency of time domain for long impulse responses. The latency of the system is the duration of a single frame.
Impulse Response Database Fetcher: Given a pair of emitter and receiver points generates an interpolated impulse response.

Diagram of the low latency convolution processing component.
Interface components
In order to control the positions of the emitter and the receiver on the scene we developed a widget that sends two controls depending on a point within a surface. The same control also served to control the head orientation of the receiver.
This control served as a first use case of a widget having to be connected to two different connection points. This forced us to use a different property than the name to do the binding.
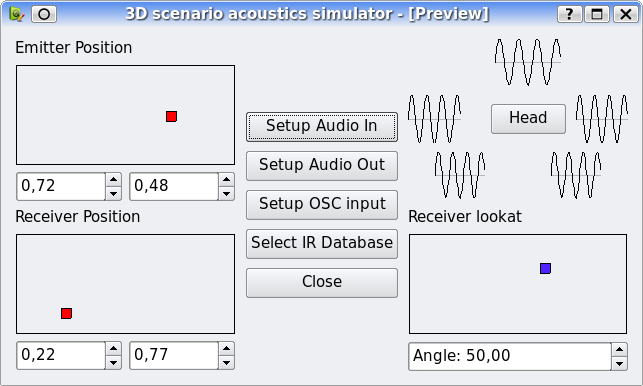
The interface for the 3D scenario acoustics simulation
Discussion
We built each of those components and test them independently, and assembling them to have the final system.
When reimplementing the spectral processing building blocks, having the basic implemented in such a modular way was very useful to experiment on which is the most efficient way of doing operations in the sense of which representation is harder to obtain and to operate on.
Overall discussion
This section summarizes the insights obtained from the previous experiments. To do so, we follow the systematic criteria enumerated in sec:VPL and sec:EvaluatingTools.
Ceiling and Threshold
The architecture lowers the learning threshold, by no requiring programming skills and hiding hard audio related implementation details to the designer. Still the architecture provides a relatively high complexity ceiling to the set of applications that can be built just visually. But it also offers mechanism to raise such ceiling by extending existing components or by programming a more complex application logic.
Path of least resistance
A tool based on such architecture offers a path of least resistance which leads to good design decisions, for example, separating processing and interface in different threads, setting controlled real-time and thread-safe means for communicating them, modularizing processing and the visual elements, and reusing components among designs.
Predictability
The execution of the network is deterministic and predictable. Although the scheduling algorithm could take different orders of module firings because of dependencies, this should not affect the result.
Moving Target
Moving target criteria is something that could happen in the future but can not be predicted.
Closeness of mapping
The application to be built has been split in two domains. Each domain has been addressed by a visual domain-specific language which is close to the abstractions we use.
In the case of the processing domain the visual language we use the data-flow paradigm which is very close to the modular design often used in signal processing.
Moreover, most of the modules and the shared data are high level, so we are not dealing with low level programming constructs such as LabView, ProGraph or PD, encouraging the users to encapsulate that level of programming within a C++ programmed module.
On the interface domain, we are dealing with widgets, layouts and properties which are also entities, interface designers are used to.
Viscosity
Conceptually the data-flow interface has the same flaws that other visual languages in the sense that changes mean to lay out again the components. A lot of time is wasted in that kind of task. This is something that the Network Editor tool could solve by providing means of automatic layout.
Anyway, producing small changes is not hard conceptually. SMS example gave a lot of examples where going from one application to another was a matter of switching some processing modules.
Also new usability features has been added to leverage tedious tasks such as providing access to the port monitors that can be connected to a port in the contextual menu of the port, the ability of adding controls senders with a double click on the receiving control...
Hidden dependencies
As shown on the SMS use case, the 4MPS abstraction makes data dependencies explicit. This is good, but we also found on the system a very nasty hidden dependency: Whenever you change the name of a port or the name of a processing, the connections with the interface can not established. This is something to solve in the future.
In the case of the ports, which depends on the module implementation, this issue could be solved by providing port alias after a rename. Those port alias could be stored within the factory meta-data. Also a migration tool could be helpful. That tool could update such names, which corresponds to a migration alias, whenever an old network is loaded.
Renaming the modules is something that could be handled by synchronizing both prototyping tools.
Hard mental operations
Because the high level of the processing operations, hard mental operations are hardly found.
Secondary notation
Naming and layout are the currently available secondary notations on the processing visual building. They are not hard to master but they are hard to keep. The layout because it is hard to keep when changes are introduced. The naming because the hidden dependency previously explained.
It would be interesting adding documentation facilities such the ones explained in [BurnettEtalComputer1995].
Consistency
We have not detected any consistency flaw but in the naming of the actual names of the ports and module types. I mean, ports does not follow the same naming convention so it is hard to remember the port names. Of course, this is not a flaw of the architecture neither on the architecture implementation but on the module implementation, although the implementation could enforce some kind of convention.
Progressive evolution
Along the examples, we have used progressive evaluation as the methodology to get the applications up and running. Modularization enables white box and black box testing.


